Image for Data visualization toolkit: using JavaScript, Rails, and Postgres to present data and geospatial information

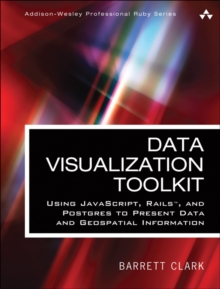
Data visualization toolkit: using JavaScript, Rails, and Postgres to present data and geospatial information

Part of the Addison-Wesley professional Ruby series series
See all formats and editions

Data Visualization Toolkit offers a hands-on, practical, and holistic approach to the art of visualizing data.

Youll learn how to use Postgres, Rails, D3 and Leaflet to create beautiful visualizations and maps that give your data a voice -- and make it dance!

Barrett Clark teaches through real-world problems and examples developed specifically to illuminate the concepts and techniques you need to generate highly effective data visualizations.

Youll move from the absolute basics towards deep dives, mastering diverse visualizations and gaining an expert understanding of when to use each.

Coverage includes: ActiveRecord and D3: making charts, transforming data, incorporating interactivity, and large data sets Generating data-driven answers to specific questions SQL In Rails: Using Window Functions, Subqueries, and Common Table Expression in Rails Geospatial Rails: Using and querying geospatial data with PostGIS, and building maps with Leaflet Everything here is aimed at one goal: to help you cut through the clutter and let your data tell you all it can.

Read More
Available
£172.74
Add Line Customisation
Available on VLeBooks
Add to List
Product Details
Pearson Addison Wesley
0134465253 / 9780134465258
eBook (EPUB)
04/08/2016
English
256 pages
Copy: 10%; print: 10%
Description based on CIP data; resource not viewed.