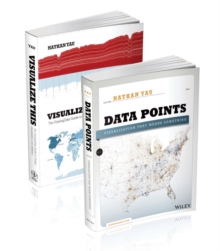
Image for FlowingData.com data visualization set

FlowingData.com data visualization set

See all formats and editions

'Visualize This' is a guide on how to visualize and tell stories with data, providing practical design tips complemented with step-by-step tutorials.

It begins with a description of the huge growth of data and visualization in industry, news, and government and opportunities for those who tell stories with data. 'Data Points' focuses on the approach to visualization and data.

Read More
Available
£47.50
Add Line Customisation
Available on VLeBooks
Add to List
Product Details
Wiley-Blackwell
1118906780 / 9781118906781
eBook (Adobe Pdf)
18/12/2013
English
697 pages
Copy: 10%; print: 10%
Description based on CIP data; resource not viewed. Contents: Visualize this. Originally published: 2011 -- Data points.